
How do I read and understand student progress reports?
XtraMath provides different progress reports to help you understand how students are progressing and identify areas where they may need additional support.
You can access three types of progress reports from your online parent or teacher account. School and district license administrators also have access to School Usage Reports, which provide an overview of program usage across their school or district.
You can also receive weekly progress report emails with a PDF attachment:
- Teachers: A weekly Class Report.
- Parents: A weekly Student Report.
To manage your email preferences, sign in to your XtraMath account and visit your Account page.
💡 If your student is using XtraMath while you’re viewing the online report, you’ll need to refresh the page to see their updated progress!
Class Report
The Class Report gives teachers a clear view of their entire class’s progress, making it easy to review each student’s daily activity and overall progress.
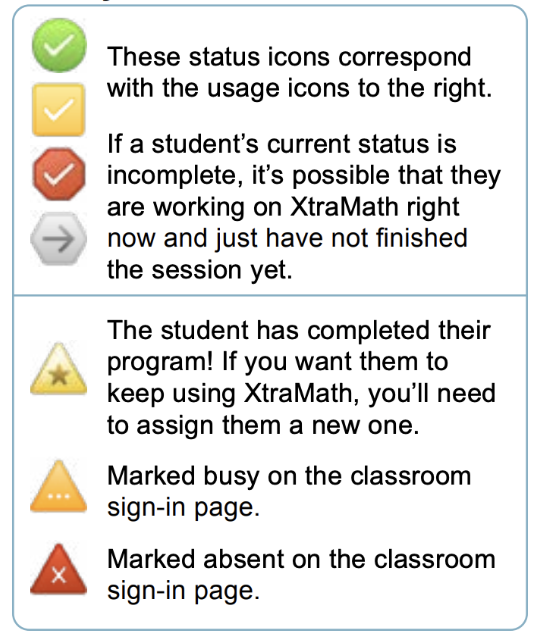
Today’s Student Usage Status
An icon on the left side next to each student’s name shows their practice status for the day:
Current Operation and Fluency Score
The column to the right of each student’s name shows the math operation they’re currently practicing and their fluency score for that operation.
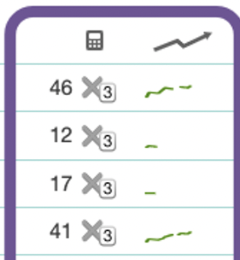
If no score appears, the student hasn’t completed the initial placement for that operation yet.
The operation icon provides two additional details:
- Inset number: Shows the fluency threshold assigned to that operation.
- Icon shade:indicates the problem set.
- White: Beginning
- Gray: Regular (up to 9s)
- Black: Expanded (up to 12s)
Next to the operation, you’ll see a small progress graph called a sparkline. It shows how the student’s fluency score has changed over time, helping you track their progress at a glance.
Recent Usage
The columns on the right show each student’s XtraMath activity over the last several days or week, with today’s activity appearing in the far-right column.
Each colored icon is clickable. Select an icon to open the student’s Date Report and see more details about their session on that day.
These icons match the colored shapes shown on the student’s Student Report calendar, making it easy to connect daily activity with the student’s progress history.
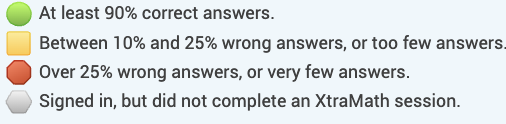
Learn more: Why does the report show my student has “incomplete” sessions?
Student Report
The student report shows an individual student’s progress over time. It includes a calendar showing days of activity, the trophies and certificates the student has earned, and detailed information about their progress in each operation.
Calendar
The calendar shows when the student has used XtraMath. Each day they log in has a colored icon. The icon and color indicate roughly how the student did that day, based on how many facts they answered, the speed and accuracy of their answers, and whether they completed a session.
💡 If you click a date with a colored icon, it will take you to the corresponding date report.

Awards
Below the calendar is a panel showing all the trophies and certificates the student has earned. It automatically expands whenever your student earns a new trophy or certificate (within the last week).
Operation Details
Finally, the details about each operation the student has worked on. This includes the fluency score, a progress graph, and a fluency matrix.

The Student Report gives you a closer look at each student’s progress, including their current fluency score, which math facts they’ve mastered, and how their performance has changed over time.
Fluency Score and Fact Matrix
The fluency score shows the student’s current progress in each math operation. If no score appears, it means the student hasn’t completed the initial placement for that operation yet. Placement may take several practice sessions to complete.
The fact matrix displays all the math facts for that operation. Each fact is color-coded to help you quickly identify which facts the student has mastered and which ones need more practice.
Progress Graph
The progress graph shows how the student’s fluency score has changed over time, helping you track improvement and see their progress at a glance.
The date report shows
On the date report, you can see every question the student answered on a given day. The date report shows exactly how the student did during each activity, such as how many facts were attempted and how they were answered.
💡 This is more detail than you usually need (so these reports are not emailed weekly), but it gives you an in-depth look into how the student is performing.

Answer icons
Smiley Face= Answered correctly within the fluency threshold. This depends on the program but defaults to 6 seconds.
Green Checkmark = Answered correctly, but beyond the fluency threshold.
Red X = Answered incorrectly. The incorrect answer entered is shown.
Blue hourglass = No response given before time ran out and the correct answer was shown.
Moon = Idle time after the correct answer was shown.